Note: To see the latest median and average house price go to my latest post "Median and Average House Prices in USA Since 2000"
| Year | Median House Price | Percent Gain |
| 1963 | $18,000.00 | 5.00% |
| 1964 | $18,900.00 | 5.82% |
| 1965 | $20,000.00 | 7.00% |
| 1966 | $21,400.00 | 6.07% |
| 1967 | $22,700.00 | 8.81% |
| 1968 | $24,700.00 | 3.64% |
| 1969 | $25,600.00 | -8.59% |
| 1970 | $23,400.00 | 7.69% |
| 1971 | $25,200.00 | 9.52% |
| 1972 | $27,600.00 | 17.75% |
| 1973 | $32,500.00 | 10.46% |
| 1974 | $35,900.00 | 9.47% |
| 1975 | $39,300.00 | 12.46% |
| 1976 | $44,200.00 | 10.40% |
| 1977 | $48,800.00 | 14.13% |
| 1978 | $55,700.00 | 12.92% |
| 1979 | $62,900.00 | 2.70% |
| 1980 | $64,600.00 | 6.65% |
| 1981 | $68,900.00 | 0.58% |
| 1982 | $69,300.00 | 8.65% |
| 1983 | $75,300.00 | 6.10% |
| 1984 | $79,900.00 | 5.50% |
| 1985 | $84,300.00 | 9.13% |
| 1986 | $92,000.00 | 13.50% |
| 1987 | $104,500.00 | 7.65% |
| 1988 | $112,500.00 | 6.66% |
| 1989 | $120,000.00 | 2.41% |
| 1990 | $122,900.00 | -2.35% |
| 1991 | $120,000.00 | 1.25% |
| 1992 | $121,500.00 | 4.11% |
| 1993 | $126,500.00 | 2.76% |
| 1994 | $130,000.00 | 3.00% |
| 1995 | $133,900.00 | 4.55% |
| 1996 | $140,000.00 | 4.28% |
| 1997 | $146,000.00 | 4.45% |
| 1998 | $152,500.00 | 5.57% |
| 1999 | $161,000.00 | 4.96% |
| 2000 | $169,000.00 | 3.66% |
| 2001 | $175,200.00 | 7.07% |
| 2002 | $187,600.00 | 3.94% |
| 2003 | $195,000.00 | 13.33% |
| 2004 | $221,000.00 | N/A |
| Average Median House Price Growth | 6.26% | |
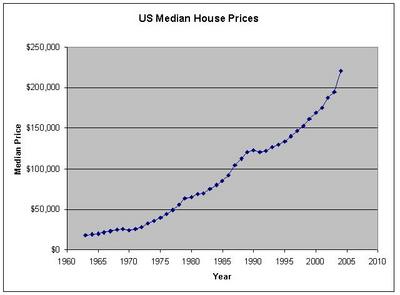
The following chart depicts the data above. The last data point of 2004 looks out of sync. We may see some mean reversion in the following year. I hope this chart provides a clear picture to you about the US housing market.

One important thing to think about from this post. The median house prices rose on average 6.26% each year for last 40+ years, and today's mortgage rates are below 6%.
All disclaimers apply.
Data Source: http://www.census.gov/const/uspriceann.pdf
8 comments:
The comment about the ratio of the house price rate to the interest rate is interesting. However, if these are the median sales price data, then since houses have been getting bigger over the years, the figures don't represent the change in value of a fixed set of houses (e.g., the one I own).
I believe there is data that follows a fixed set of houses, which would be more interesting. Also, displaying in constant-value dollars (i.e., allowing for inflation) would be more of a "real return" kind of thing.
If you look at Robert Shiller chart of housing price over 116 years the National median house price should be around $100,000. The jump in the past 7 years is abnormal.
http://housingpanic.blogspot.com/
http://photos1.blogger.com/blogger/
6089/1833/1600/shiller.gif
If housing has grown 6% on average over 40 years, and if you can lock your mortgage rates in now below 6%, then who cares about inflation?
I'm not sure of rental yields in the US, but in Australia they're typically 5%, operating costs in the long term might run at 2.5%, so that's another 2.5% of creme on top.
If you live in it and can claim a tax deduction on the interest, with a marginal tax rate around 40%, then a 4% interest rate drops to 2.4%. Add in depreciation of the building at 2.5% p.a. (I assume you also have this in the US?), and the fact that you can gear it at 95% LVR, or even higher, with no margin calls, and it starts to look pretty attractive.
Long term returns on the stock market, if you take the depression into account are roughly 7%. All in all housing ain't that bad an investment, even if the tenants are a pain :)
So, what does it mean when you look at a particular property as a percentage of median price. That is, If a house was bought in 1980 for 106% of median and it is now work about 120% of median, does that mean you invested well??
How did you come up with this data? I don't believe that it is correct. Please cite your sources if you didn't make it up. Thanks.
Don't you not see the datasource at the bottom of the post?
yea,I totally agree with comment number 9.Think or in this case look befor you act.This is for comment number 8.
The median home price is one of the most common measurements used to compare real estate prices in different markets, areas, and periods. It is said to be less biased than the mean price since it is not as heavily influenced by small number of very highly priced homes.
Rocky Hayes
Boligselskaber
Post a Comment