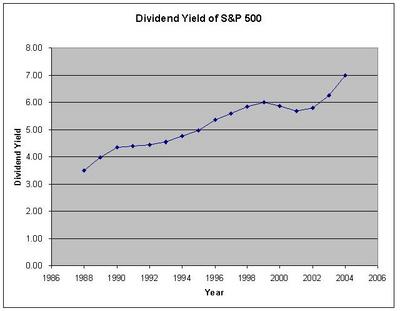
In the table below I display the dividends paid out by S&P index from year 1988 to 2004. On 12/31/1988 the S&P 500 index closed at 277.78. The total dividend payout in dollar terms was $9.73 to investors. Hence, the dividend yield was 3.50% at the end of 1988.
| Year | S&P 500 Cash Dividend | S&P 500 Dividend Yield |
| 1988 | $9.73 | 3.50% |
| 1989 | $11.05 | 3.97% |
| 1990 | $12.09 | 4.35% |
| 1991 | $12.20 | 4.39% |
| 1992 | $12.38 | 4.45% |
| 1993 | $12.58 | 4.52% |
| 1994 | $13.18 | 4.74% |
| 1995 | $13.79 | 4.96% |
| 1996 | $14.90 | 5.36% |
| 1997 | $15.49 | 5.57% |
| 1998 | $16.20 | 5.83% |
| 1999 | $16.69 | 6.00% |
| 2000 | $16.27 | 5.85% |
| 2001 | $15.74 | 5.66% |
| 2002 | $16.08 | 5.79% |
| 2003 | $17.39 | 6.26% |
| 2004 | $19.44 | 7.00% |
Suppose an investor bought one share of the S&P index at 277.78 in 1988. This investment yielded 3.50% at the time of purchase. Now, in 1989 this stock produced $11.05 in income. The yield in 1989 was 3.97%. After 15 years, in 2004 the same stock produced an income of $19.44. The yield in 2004 was 7.00%.
Following chart displays the year and dividend yield of the S&P 500.

Even though the current dividend yield is tiny 1.79%, the investors who bought into S&P 500 index fund in 1988 are enjoying 7% dividend yield right now.
Data Source: S&P 500 Earnings & Estimate Report
2 comments:
You probably should adjust the basis of the original investment by inflation to get the true yield in this example, since so much time passes from the original investment. The Consumer Price Index (CPI) is the standard method of adjusting for inflation. There is a handy tool on www.bls.gov that allows you to adjust dollar amounts to any base year.
After you make the adjustment, you are likely to find that the yield is substantially lower for S&P 500.
That *is* a different way to look at it.
Post a Comment