| Year | Dividend (Billions) | Dividend Growth Rate |
| 1988 | $67.35 | - |
| 1989 | $74.13 | 10.05% |
| 1990 | $80.47 | 8.55% |
| 1991 | $81.88 | 1.75% |
| 1992 | $85.18 | 4.02% |
| 1993 | $88.12 | 3.44% |
| 1994 | $95.21 | 8.04% |
| 1995 | $101.69 | 6.81% |
| 1996 | $112.62 | 10.74% |
| 1997 | $119.51 | 6.11% |
| 1998 | $128.84 | 7.80% |
| 1999 | $137.53 | 6.74% |
| 2000 | $141.08 | 2.58% |
| 2001 | $142.21 | 0.80% |
| 2002 | $147.81 | 3.93% |
| 2003 | $160.64 | 8.68% |
| 2004 | $181.01 | 12.67% |
| Average Dividend Growth Rate | 6.24% | |
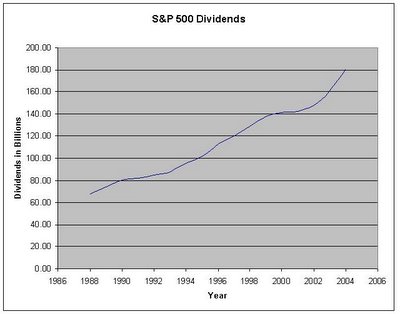
From the growth column numbers you can see that the dividends have always increased year over year. The year over year dividend payments have not gone down in spite of 2000 bubble burst, corporate scandals, or recent wars. The average growth rate of the dividends has been 6.24% since 1988.
Doing calculations with price in denominator or numerator is very tricky. The price/earnings, price/book-value, price/dividends, and even the dividend yield can swing wildly with volatility in price. But, when we remove the price from the equation and look at raw dividend numbers, the noise (volatility) is almost always gone from the numbers and we are left with smooth ride. The key here is to learn to disregard the volatility of price when we invest our money, the long-term investors should benefit greatly from it.
Below is the chart of the above data.

5 comments:
I wonder if the dividend tax cut has affected the steeper growth rate recently? Combined with corporate revenue growth.
Hazzard,
It is very unlikely that if you are invested in a low cost index fund like Vanguard 500 index fund and you don't see any dividend each year. The Vanguard 500 index fund does pay out dividends each and every quarter regularly.
Regards.
Does the S&P500 index, as it varies from day to day, include an ongoing adjustment in value that reflects the dividends paid by its member companies?
I wonder, what is the source for S&P dividends information?
Interesting observation but not useful for dividend investing. If I own stock I get paid a dividend amount "per share". Looking at total dividends paid ignores the problem caused by dilution of new share issues. I don't know that the total number of shares outstanding is increasing, certainly some companies are buying back shares while others issue new ones. But, you can't look at growth of total dividends paid without looking at growth rate of total shares outstanding.
Post a Comment