Friday, October 21, 2005

Bill Miller Commentary

"I think the market is going up."
- Bill Miller ( Portfolio Manager’s Quarterly Commentary – Third Quarter 2005, Legg Mason Value Trust, LMVTX )

Here is the summary of the market commentary:
  • Bill Miller finds it curious that every stock market in the world has gone up this year, except China, Slovenia and the US.
  • There are two things holding down the US market: Oil price rise after the Hurricanes, and relentless rise of the fed funds rate.
  • The oil prices may have already peaked and fed may be about to stop after a couple of more fed fund up moves.
  • Bill Miller likes mega cap S&P 500 names, and finds that “financials and technology appear most attractive”.

Thursday, October 20, 2005

Impact of P/E ratios on Long-term Returns

“A 40% increase in P/E ratio over a 40-year period increases returns by less than 1% annually. Similarly, a 40% plunge in the P/E ratio over that holding period reduces returns by just over 1% annually.”
- John P. Hussman (The 40 year forecast for the S&P 500 Index)

This makes sense to me.

The broad market’s P/E ratio is about 20 today. Is market overvalued? Undervalued?

Let’s suppose someone is in his/hers middle 20’s and buys into S&P 500 at today’s prices. This person wants to retire at the age of 65 and intends to sell the S&P 500 holding at that time.

If the terminal P/E at the sell-time is at 12, 40% below the P/E of today; the total impact on the overall return will be just about 1% annually.

Also, if the terminal P/E at the age of 65 is at 28, 40% above the P/E of today; the total impact on the overall return will be just about 1% annually.

The time is key here. The time dampens the effect of the swings in the market and smoothes out the averages. The big swings in the market valuations like the 40% rise or fall in P/E ratio has very negligible effect on the outcome of the long-time buy-and-hold portfolios.

Is market overvalued? If the time is on your side, paying 40% higher P/E will reduce your returns over the 40 years by only 1%.

Is market undervalued? You tell me.

Saturday, October 15, 2005

Life Cycle of Bull Markets

Bull Markets are born in pessimism, grow on skepticism, mature of optimism, and die of euphoria.

- Sir John Templeton

Saturday, October 08, 2005

Income From Stocks

The current dividend yield of the S&P 500 index is 1.79%. Because of this paltry current yield, it is very hard to imagine the broad index such as S&P 500 as an income producing investment. But, if you take a closer look at the numbers then you can see that common stocks can provide amazing returns through the dividend.

In the table below I display the dividends paid out by S&P index from year 1988 to 2004. On 12/31/1988 the S&P 500 index closed at 277.78. The total dividend payout in dollar terms was $9.73 to investors. Hence, the dividend yield was 3.50% at the end of 1988.

Year S&P 500 Cash Dividend S&P 500 Dividend Yield
1988$9.733.50%
1989$11.053.97%
1990$12.094.35%
1991$12.204.39%
1992$12.384.45%
1993$12.584.52%
1994$13.184.74%
1995$13.794.96%
1996$14.905.36%
1997$15.495.57%
1998$16.205.83%
1999$16.696.00%
2000$16.275.85%
2001$15.745.66%
2002$16.085.79%
2003$17.396.26%
2004$19.447.00%

Suppose an investor bought one share of the S&P index at 277.78 in 1988. This investment yielded 3.50% at the time of purchase. Now, in 1989 this stock produced $11.05 in income. The yield in 1989 was 3.97%. After 15 years, in 2004 the same stock produced an income of $19.44. The yield in 2004 was 7.00%.

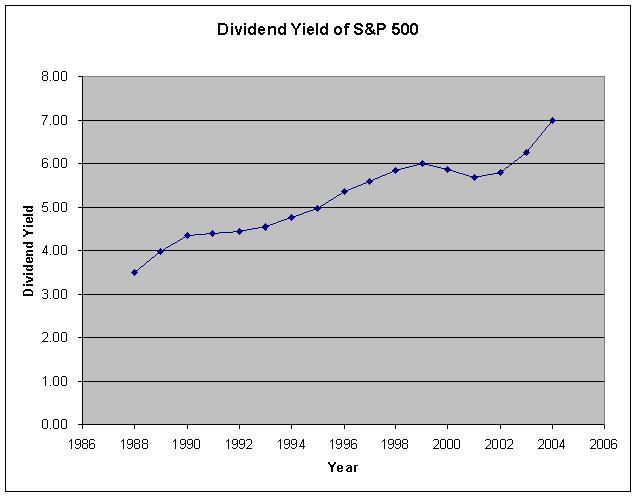
Following chart displays the year and dividend yield of the S&P 500.

Dividend Yield of the S&P 500 Index
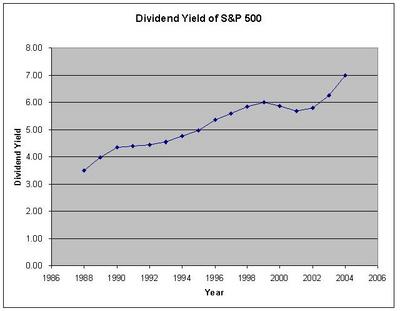
Even though the current dividend yield is tiny 1.79%, the investors who bought into S&P 500 index fund in 1988 are enjoying 7% dividend yield right now.

Data Source: S&P 500 Earnings & Estimate Report